Why Your Jersey City Basement Is Wet and Your Friend's Is Dry
Because Jersey City is three water problems wearing one name, and which one you have is decided by where your address sits on the hill. USGS puts Pershing Field in the Heights at 156.8 feet and Exchange Place on the waterfront at 6.2 feet, two and a half miles apart in one city, and the water that reaches a basement at each end arrives by a different route and needs a different repair.
Already know you need someone out? Call (315) 640-3590, answered 24/7.
Which of the three Jersey City water routes you have
Note the hour it appears
You, during the next heavy rainDuring the rain points at surface water or the combined sewer. Hours afterward points at groundwater moving downslope through the ground. All summer regardless of rain points at humidity.
Find the entry point, not the puddle
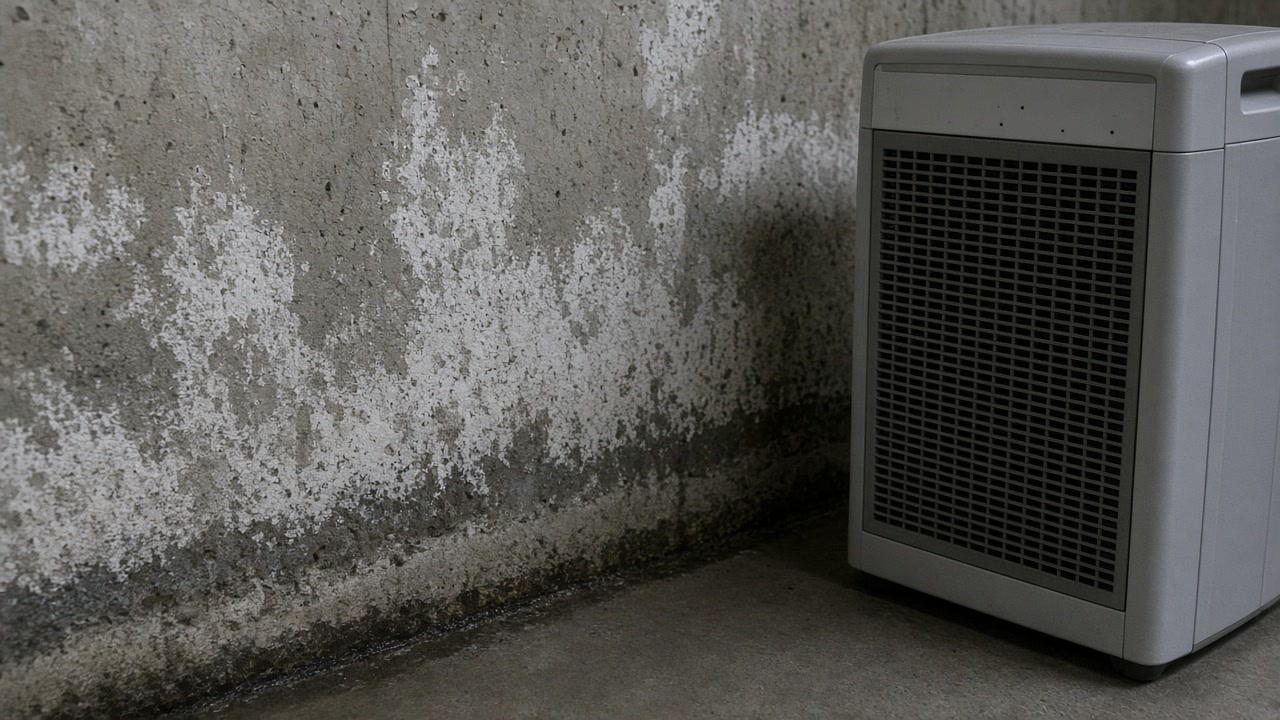
You, with a flashlightWater spreads across a floor, so the lowest wet spot is rarely where it came in. Look for a floor drain, a slab crack, a damp band along the base of a wall, or beads on cold pipes and cold corners.
Look uphill and look up
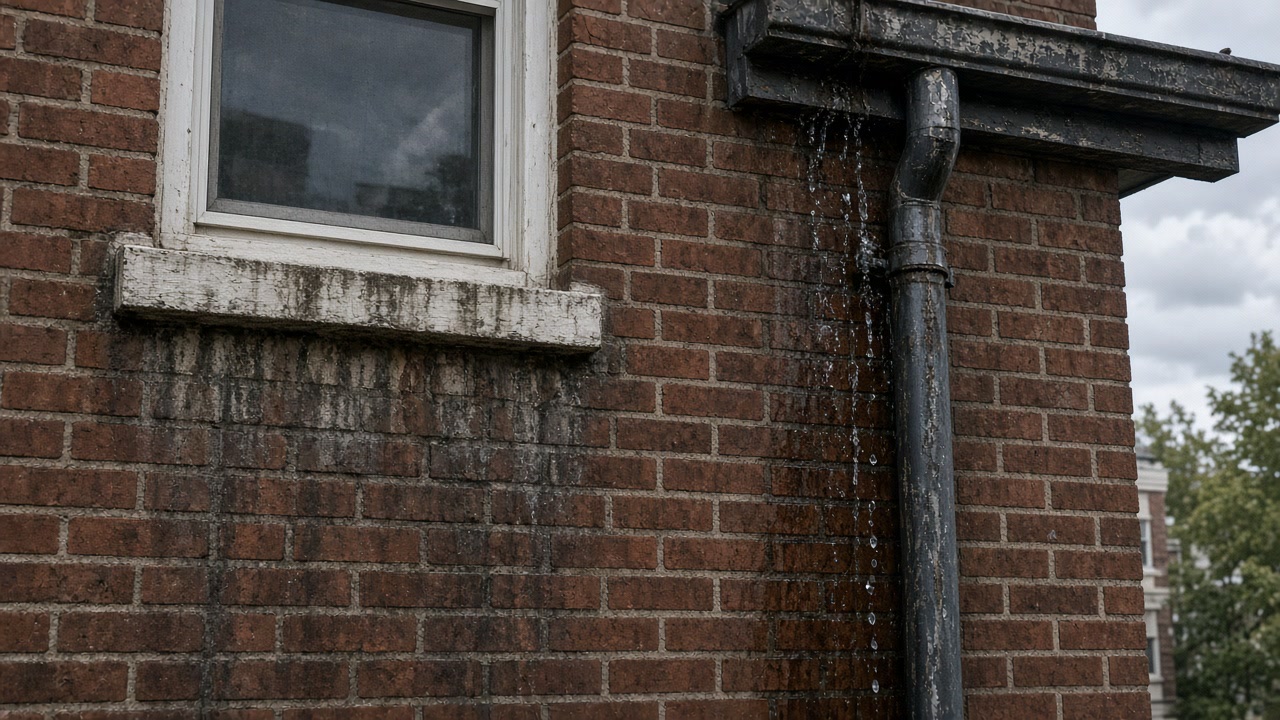
You, outside the buildingDownspouts discharging at the foundation, blocked leaders, a cracked area drain and ground sloping back toward the wall explain more wet basements here than the foundation itself does.
Match the route to the trade
An assessor with nothing to sell youSewer water up a drain, hillside seepage through a wall and summer condensation are three different scopes of work. Getting the route wrong is how a dehumidifier problem turns into a demolition quote.
Four checks you can make yourself before anybody is paid. They point at three different scopes and three very different bills.
The ridge is why two Jersey City basements behave nothing alike
Jersey City covers about fifteen square miles and falls from a ridge to a harbor inside them. USGS elevation queries return 156.8 feet at Pershing Field in the Heights and 6.2 feet at Exchange Place on the waterfront, two and a half miles apart in the same municipality. The insurance record shows what that height difference does to houses: since 1978, ZIP code 07302 on the Downtown waterfront has recorded 1,097 flood claims and about 31.5 million dollars paid, while ZIP code 07307 up in the Heights has recorded eight claims and 44,593 dollars across the entire period. Those are not two points on one spectrum. They are two different problems that happen to share a city hall. So the useful question is never what Jersey City does in a storm. It is what your block does, and that starts with how high you are and which way your ground falls.
Downtown and the waterfront: the water comes up, not in
At the bottom of the drainage the basement is the lowest opening in the system, and Jersey City runs on a combined system, where a single pipe takes household wastewater and street runoff to the same place. NJDEP lists 22 active combined sewer outfalls inside the city. When rain fills that system faster than it can discharge, the pressure finds the nearest low opening indoors, which is a floor drain, a utility sink or a shower pan, and the water that appears has been in a pipe with sanitary waste. USGS puts Exchange Place at 6.2 feet, Newport at 9.3, the Grove Street PATH station at 10.4, Hamilton Park at 11.8 and Paulus Hook at 13.8, so most of Downtown sits inside one narrow band of elevation. The county hazard mitigation plan names the area of Bates Street as experiencing combined sewer overflow flooding that reaches streets and buildings, and proposes sewer separation there as its own project. In this zone a wet basement is a contamination question before it is a drying question.
On the Heights and the Western Slope the water comes in sideways
Up on the ridge the harbor is irrelevant and the hillside is not. USGS returns 165.6 feet at Kennedy Boulevard near Manhattan Avenue, 152.6 feet at Hutton Street, 144.4 feet at Central Avenue near Bowers Street and 113.3 feet at Palisade Avenue near Ferry Street, which describes a slope rather than a plateau. Rain that lands uphill travels through soil and old fill until it meets the first solid thing in its path, and on these blocks that is somebody's foundation wall. It presents as a damp band low on the wall, salt bloom on stone or brick, a musty smell that is worse the day after rain than during it, and a sump pump that almost never runs because there is no rising water table for it to find. The building stock sharpens it: in ZIP 07307 the median housing unit was built in 1952 and 44.5 percent of its units date from 1939 or earlier, so the wall holding back the hill is often unreinforced masonry with no exterior damp proofing at all. The repair is drainage and grading outside, not machinery inside.
The West Side and Greenville send their water the other way
Cross the ridge and the drainage reverses. USGS returns 8.0 feet at West Side Avenue in the Marion section, 9.3 feet near Country Village, 14.4 feet at Lincoln Park and 22.7 feet near Route 440, which is low ground draining toward the Hackensack rather than the Hudson. That is not an administrative detail. Of the 22 city outfalls, ten discharge to the Hudson River, eight to the Hackensack River, two to Newark Bay at Danforth Avenue and Mina Drive, and two to an unnamed tributary of Penhorn Creek, so a West Side block sits on a different pipe with a different receiving water and a different tide cycle from a Downtown block. Greenville is not one thing either: USGS returns 66.2 feet on Martin Luther King Drive and 8.1 feet on Ocean Avenue, a fall of 58 feet inside a single neighborhood. Part of Greenville has the hillside problem and part of it has the low ground problem, on the same bus route.
Rain does this far more often than the tide does
Most people here picture a surge off the river and brace for the wrong event. Coding the Jersey City flood claims by cause of damage gives 1,015 claims for accumulation of rainfall or snowmelt against 357 for tidal water overflow and 310 for stream, river or lake overflow, which makes rainfall about 56 percent of everything filed. The two storms everybody names make the same point from opposite directions. Sandy produced 642 Jersey City claims and about 41.9 million dollars, of which 277 were coded tidal. The remnants of Ida produced 195 claims and about 4.2 million dollars, of which 156 were coded rainfall or snowmelt and only six were tidal. A tidal event finds the waterfront. A rainfall event finds everyone whose gutters, grade or sewer connection cannot move water away fast enough, and that is a much longer list of addresses, most of them nowhere near the Hudson.
Being outside the FEMA flood zone has never meant a dry basement
The flood map describes one kind of water, and your wall does not know that. 201 Jersey City claims, about 4.9 million dollars worth, were paid on policies rated in zones X, B or C, which sit outside the mapped special flood hazard area. The city says the rest itself: its annex to the county hazard mitigation plan states plainly that outside the FEMA floodplain boundaries it does not have updated flood risk data showing areas subject to pluvial flooding, localized flooding from the combined sewer system, or surge risk. In other words there is no published map of the thing that most often wets a basement here. Nor is a quiet claim history on your street evidence of anything, because Jersey City carries 1,122 flood insurance policies against 135,231 housing units, under one percent of the stock. Almost nobody here is in a position to file, so almost nothing gets recorded.
The fourth answer, which nobody is selling you: nothing is leaking
A large share of what looks like a leak in this city is simply summer air. The NOAA 1991 to 2020 hourly normals for Newark Liberty give a mean July dew point of 63.3 degrees Fahrenheit and a mean August dew point of 62.8, with the hourly normal peaking at 65.6 in both months. Any surface colder than that pulls water out of the air, and a below grade wall, a slab, a cold water line and the back of a closet on an exterior wall are all colder than that through most of a Jersey City summer. The signature is easy to recognize once you know it: it starts in June and fades in October, it is worst in still corners rather than at the lowest point in the room, and it does not get worse when it rains. If that is what you have, the answer is a dehumidifier sized to the space, left on a humidistat, plus air movement in the dead corners. That is a purchase, not a contract, and you do not need us for it.
How to tell which one you have before you pay anybody
Three questions usually settle it and you can answer all three without help. When does it appear: during and just after heavy rain points at surface water or the sewer, several hours later points at groundwater working downslope, and steadily through the warm months points at condensation. Where does it enter: up through a floor drain or a slab crack is the low ground pattern, a damp band along the base of a wall is the hillside pattern, and moisture on cold surfaces well above floor level is humidity. What is uphill and what is above: a downspout discharging against the foundation, a blocked leader or a cracked area drain is behind a remarkable share of wet Jersey City basements. Note the timing, because if material has been wet the EPA puts the window to dry it at 24 to 48 hours, after which a drying job becomes a removal job. Jersey City's own ordinary maintenance list puts the repair, replacement or installation of exterior gutters and leaders among the work needing no permit in any structure, so the cheapest fix available is also the least obstructed one.
What to have written down before you ask anyone to look
Photograph the wet area with a date on it, note the weather on the days it showed, and write down which of the patterns above it matches. Then ask for the right thing rather than the obvious thing. The New Jersey Department of Health prints the instruction Do not simply ask for mold testing, and tells residents to request a plan to stop the water intrusion problem and a separate plan to remediate the growth, in that order, because cleaning up before the water is fixed buys a repeat visit. If you want that written by someone who is not also quoting the repair, that is an assessment, and in a city where the diagnosis is most of the value of the job it is the thing worth buying first. Send us the street and what you are seeing and we will tell you which of the three it looks like.
Sources used in this guide
USGS elevation point queries taken across Jersey City return 156.8 feet at Pershing Field in the Heights and 6.2 feet at Exchange Place on the waterfront. The two points are about 2.5 miles apart inside the same city.
Source: US Geological Survey, 3D Elevation Program point query service, accessed 2026-09-21
Sorting the Jersey City flood claims by reported ZIP code gives 1,097 claims and about 31.5 million dollars paid in 07302 on the Downtown waterfront, against 8 claims and 44,593 dollars paid in 07307 in the Heights, across the entire record since 1978.
Source: Federal Emergency Management Agency, OpenFEMA FIMA NFIP Redacted Claims dataset v2, accessed 2026-09-21
The NJDEP combined sewer outfall inventory lists 22 active outfalls in Jersey City. Twenty one are permitted to the Jersey City Municipal Utilities Authority and discharge through the Passaic Valley Sewerage Commissioners system. The twenty second belongs to the North Hudson Sewerage Authority Adams Street plant and sits at Observer Highway and Court Street on the Hoboken line.
Source: New Jersey Department of Environmental Protection, combined sewer outfall inventory served through the NJDEP ArcGIS mapping service, accessed 2026-09-21
USGS elevation queries across Downtown Jersey City return 6.2 feet at Exchange Place, 9.3 feet at Newport, 10.4 feet at the Grove Street PATH station, 11.8 feet at Hamilton Park, 12.4 feet at Van Vorst Park and 13.8 feet at Paulus Hook.
Source: US Geological Survey, 3D Elevation Program point query service, accessed 2026-09-21
The JCMUA annex of the county plan names the area of Bates Street as experiencing CSO flooding that floods streets and buildings, and proposes sewer separation there as its own mitigation action.
Source: Hudson County Office of Emergency Management, 2025 Hudson County Hazard Mitigation Plan, accessed 2026-09-21
USGS elevation queries along the Jersey City Heights return 165.6 feet at Kennedy Boulevard near Manhattan Avenue, 152.6 feet at Hutton Street, 144.4 feet at Central Avenue near Bowers Street and 113.3 feet at Palisade Avenue near Ferry Street.
Source: US Geological Survey, 3D Elevation Program point query service, accessed 2026-09-21
Inside one city, the median housing unit in ZIP code 07307 in the Heights was built in 1952 and 44.5 percent of its 19,260 units date from 1939 or earlier, while in ZIP code 07310 at Newport the median unit was built in 2005 and only 2.8 percent predate 1939.
Source: US Census Bureau, American Community Survey 2020-2024 five year estimates, accessed 2026-09-21
On the Hackensack side of the ridge, USGS elevation queries return 8.0 feet at West Side Avenue in the Marion section, 9.3 feet near Country Village, 14.4 feet at Lincoln Park and 22.7 feet near Route 440.
Source: US Geological Survey, 3D Elevation Program point query service, accessed 2026-09-21
The 22 Jersey City outfalls do not drain to one place. Ten discharge to the Hudson River, eight to the Hackensack River, two to Newark Bay at Danforth Avenue and Mina Drive, and two to an unnamed tributary of Penhorn Creek at Secaucus Road and Manhattan Avenue.
Source: New Jersey Department of Environmental Protection, combined sewer outfall inventory served through the NJDEP ArcGIS mapping service, accessed 2026-09-21
Greenville is not flat. USGS elevation queries return 66.2 feet on Martin Luther King Drive and 8.1 feet on Ocean Avenue, a fall of 58 feet inside one neighborhood.
Source: US Geological Survey, 3D Elevation Program point query service, accessed 2026-09-21
Coding the Jersey City claims by cause of damage gives 1,015 claims for accumulation of rainfall or snowmelt against 357 for tidal water overflow and 310 for stream, river or lake overflow. Rainfall is the single largest cause by count, at about 56 percent of all claims.
Source: Federal Emergency Management Agency, OpenFEMA FIMA NFIP Redacted Claims dataset v2, accessed 2026-09-21
Hurricane Sandy produced 642 Jersey City flood claims and about 41.9 million dollars, of which 277 were coded tidal. The remnants of Hurricane Ida produced 195 claims and about 4.2 million dollars, of which 156 were coded rainfall or snowmelt and only 6 tidal.
Source: Federal Emergency Management Agency, OpenFEMA FIMA NFIP Redacted Claims dataset v2, accessed 2026-09-21
201 of the Jersey City flood claims, about 4.9 million dollars worth, were on policies rated in zones X, B or C, which sit outside the mapped special flood hazard area.
Source: Federal Emergency Management Agency, OpenFEMA FIMA NFIP Redacted Claims dataset v2, accessed 2026-09-21
The Jersey City annex states plainly that outside the FEMA floodplain boundaries the city does not have updated flood risk data showing areas subject to pluvial flooding, localized flooding from the combined sewer system, or surge risk, and has no flood scenarios including sea level rise.
Source: Hudson County Office of Emergency Management, 2025 Hudson County Hazard Mitigation Plan, accessed 2026-09-21
Jersey City carries 1,122 flood insurance policies against 135,231 housing units, under one percent of its housing stock. Hoboken, with 30,259 housing units, carries 8,143 policies.
Source: Hudson County Office of Emergency Management, 2025 Hudson County Hazard Mitigation Plan, accessed 2026-09-21
The NOAA 1991 to 2020 hourly climate normals for Newark Liberty International Airport, station USW00014734, give a mean July dew point of 63.3 degrees Fahrenheit and a mean August dew point of 62.8, with the hourly normal peaking at 65.6 degrees in both months.
Source: NOAA National Centers for Environmental Information, 1991-2020 US Climate Normals, accessed 2026-09-21
The EPA states that it is important to dry water damaged areas and items within 24 to 48 hours to prevent mold growth, and that in most cases mold will not grow if wet materials are dried within that window.
Source: United States Environmental Protection Agency, accessed 2026-09-21
Jersey City publishes its own ordinary maintenance list of work needing no permit in any structure. It includes interior and exterior painting, wall covering, the repair or replacement of any flooring material with a new material, the repair, replacement or installation of interior trim and moldings, the installation of insulation other than foam plastic, and the repair, replacement or installation of exterior gutters and leaders.
Source: City of Jersey City, Division of the Construction Code Official, accessed 2026-09-21
Mold Guidelines for New Jersey Residents prints the instruction: Do not simply ask for mold testing! It tells residents to request a plan to stop the water intrusion problem and a separate plan to remediate the mold, and says that before mold can be remediated the source of water should be fixed.
Source: New Jersey Department of Health, accessed 2026-09-21
Services this guide relates to
Need someone to look at it?
Send the details and we will come back to you.